Getting Started

Installation

INFERNOde is available to install as an npm module.

All you need to do is navigate to the root of your project repo, then npm install infernode as a development dependency for your project. Using INFERNOde will require an accurate relative file path from the root of your project repo to the application you are testing, so be sure it is installed at the correct level of your repo.


Setup

INFERNOde uses dynamic tracing to profile your applications.


INFERNOde currently can only profile applications on Linux and Mac OS X. While Windows recently added dtrace compatibility to their operating systems, it requires Windows Insider Build 18342 or higher. If you are using Mac OS X, Linux, or a compatible version of Windows, keep reading. Otherwise you will need to wait for the next release to include comprehensive Windows compatibility.

Mac OS X has a protective feature called System Integrity Protection (SIP). SIP will normally prevent you from using dtrace, so to use our dtrace feature you will need to instruct your system not to ask for your password each time.

To do this you will need to run echo "$(whoami) ALL=(ALL) NOPASSWD: /usr/sbin/dtrace" | sudo tee -a /etc/sudoers to add a line to /etc/sudoers that will allow you us to run sudo dtrace without repeatedly entering your password. This only needs to be done once, and it can be checked with the sudo tail /etc/sudoers command. This does not give INFERNOde your password, and it does not affect any other permissions on your machine. This will only tell your system that password approval is not needed to run a dtrace.

When dtrace does run, you should see something similar to the following in your terminal.
dtrace: system integrity protection is on, some features will not be available
dtrace: description 'profile-150 ' matched 2 probes

Once you have that setup, just run npx infernode to launch INFERNOde.


Interested in learning more about dtrace?

Using INFERNOde

Uploading Perf Captures

Already have a perf capture you want to create a flamegraph from?

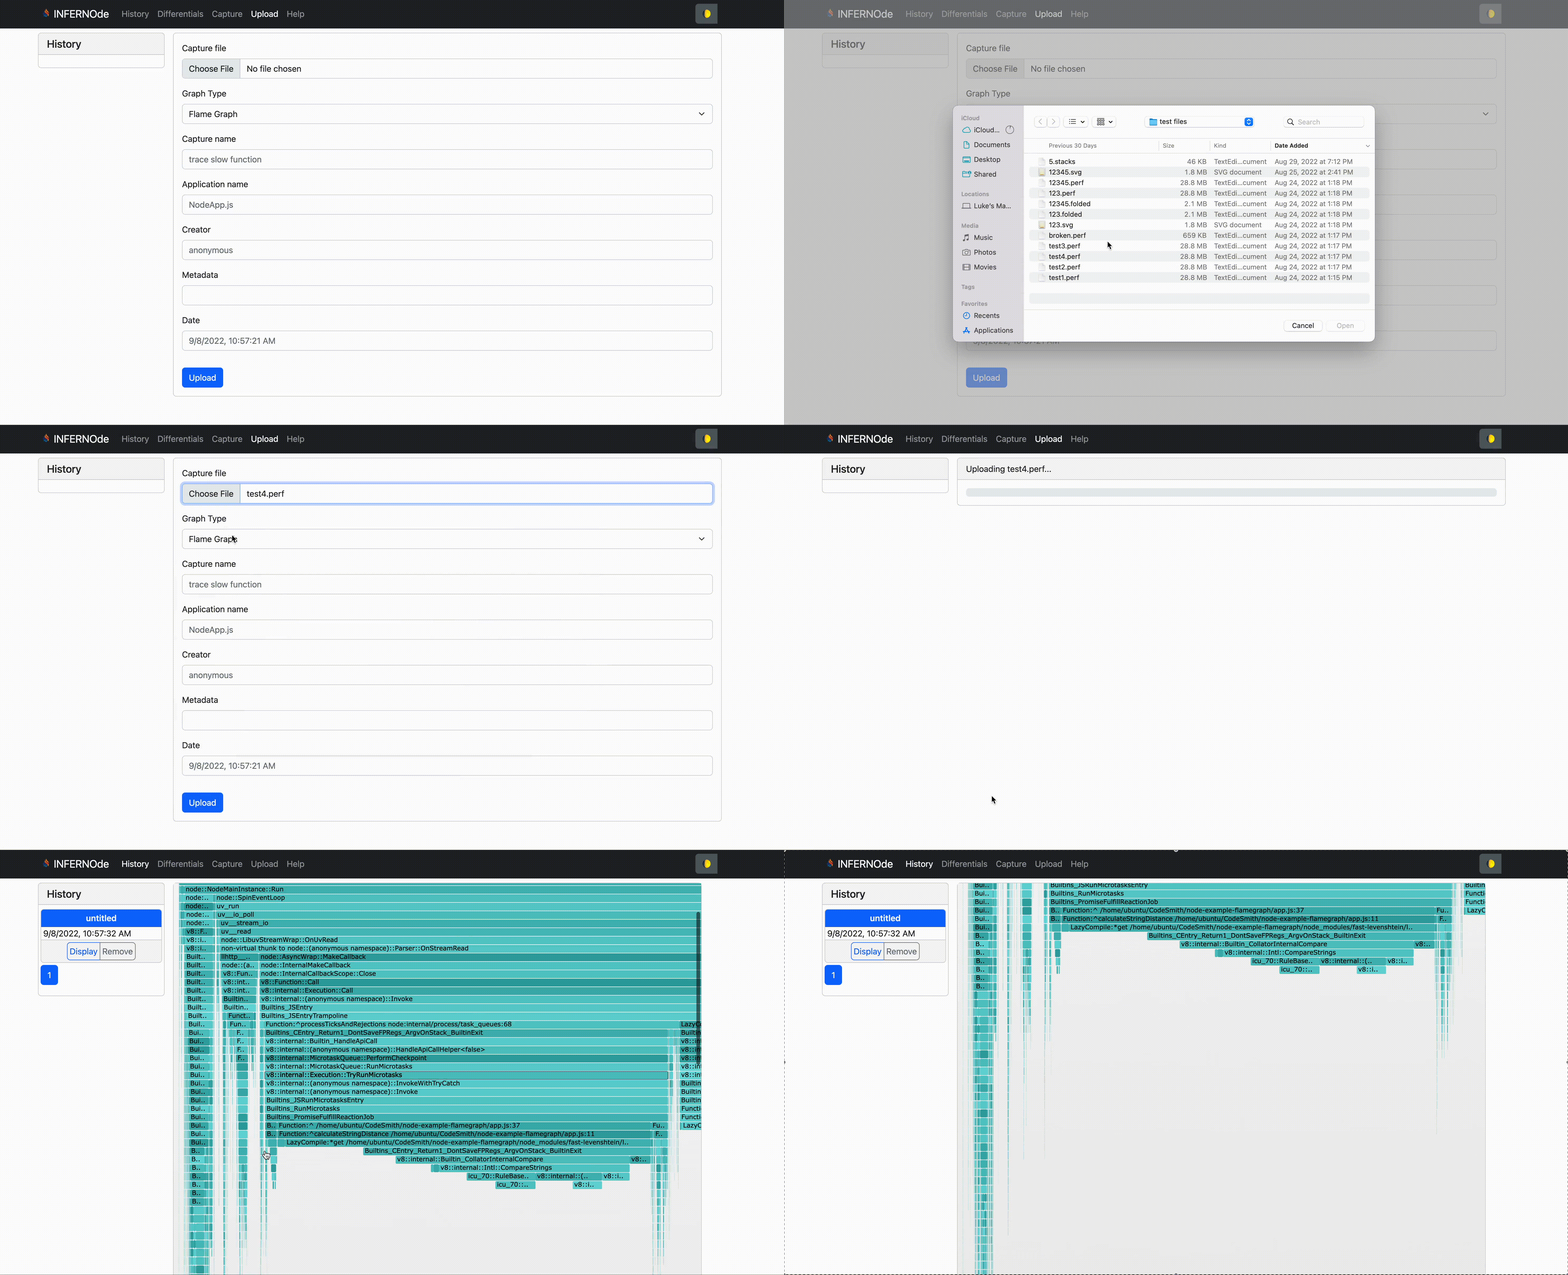
INFERNOde provides you with the option to create a flamegraph or an icicle graph from a perf capture. All you need to do is open the Upload page of the application, select your file, and wait for a glorious graph to appear.


Use the upload page to generate a flamegraph from your own perf capture.

Dtrace

Don't have a perf capture?


INFERNOde can run a dtrace or perf capture on any executable Node.js application. All we need is a relative path to the application you want to test, and how long you want to run it. INFENROde will automatically detect your operating system then run either a dtrace for Mac OS, or a perf capture for Linux.

There are two ways we can profile your application.

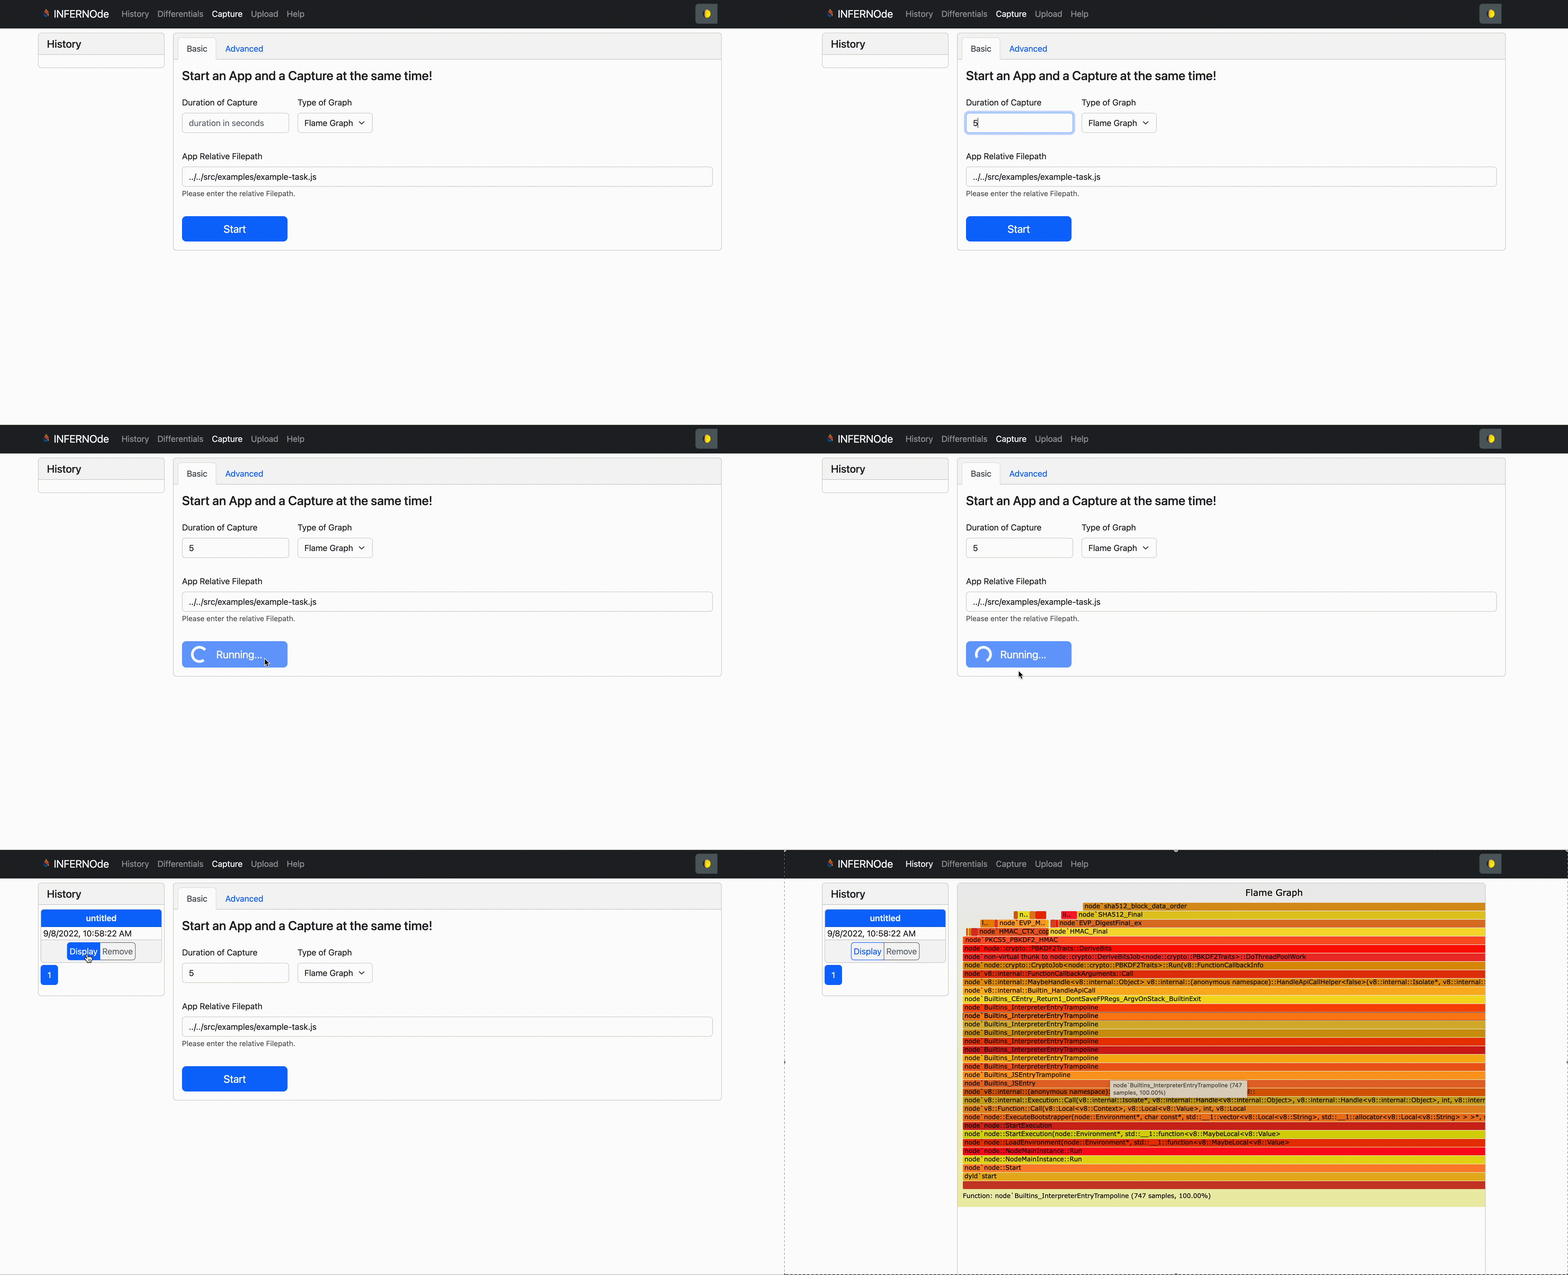
This is ideal if you your app has a short runtime or you want to include the first few seconds of your application's runtime in the capture. To do this, simply use the Basic option on the capture page. Provide a relative path to the application, the number of seconds you want the dtrace/perf to run, and choose between an icicle graph or a flamegraph. We will take care of the rest.

This is the best option if your application requires user interaction once it has launched. We can launch the application, then start the capture whenever you're ready. To do this you will need to use the Advanced option on the capture page. Provide the relative file path, then hit 'Start Application'. Then when you're ready to start the dtrace/perf, simply provide a time and hit 'Start'. Don't forget to click 'Stop Application' when you're done or your app will keep running in the background.
Use the Basic tab to start your app and dtrace at the same time, then generate a flamegraph.

Use the Advanced tab to start your app, then begin a dtrace at any time.

Make sure the file path you provide is relative to the root of your application directory where you have INFERNOde installed. Then choose whether you want an icicle graph or a flamegraph, and provide the number of seconds you want the dtrace to run. Then then sit back and relax while we do all the work for you. If the application has a finite runtime, and the duration you provide happens to be longer, there is no need to worry. Dtrace will continue running for the time you enter, but it wont affect your results.


Making Differential Flamegraphs

Compare two versions of your code

We can take any two flamegraphs and compare them to create a differential flamegraph that highlights what has changed. All it takes is two existing flamegraphs. Navigate to the Differentials page, then select the two flamegraphs you want to compare. Keep in mind that it matters which graph you choose first. Differential flamegraphs are created using a 2-1 delta. The first graph you select will provide the starting point for the comparison. The second graph will be evaluated relative to the first graph. This means that any part of the call stack that ran slower in the second graph, when compared to the first graph, will be shaded red. While parts that ran faster will be shaded blue.


Use the upload page to generate a flamegraph from your own perf capture.

For more on interpreting differential flamegraphs, check out the section below.

Graphs

Flamegraphs

Interpreting Flamegraphs


Flamegraphs are a visualization of stack traces of a profiled software application. They allow developers to quickly and easily identify hot-spots in the code that are occupying too much time and generating excessive CPU demand.

Each rectangle on a flamegraph represents a stack frame, but not necessarily one instance of that stack frame. Flamegraphs are made by taking a sample of stack traces and collapsing matching stack frames together. So a function that appears on the call stack multiple times may only be represented by one single stack frame in a flamegraph, where the total width of the single stack frame represents the total combined width of each of those individual stack frames.

Because of this, the x-axis does not represent time. But rather, a percentage of time. The wider a stack frame is on a flamegraph, the more time it spent on the call stack, relative to the total application run time that was captured in the stack trace. So if the bottom call frame on your flamegraph covers the full width of the graph, that means it was present at the bottom of the call stack for the entire duration of the application profiling. The x-axis is sorted alphabetically, and the wider a stack frame is, the more often it was present in the stacks.

Flamegraphs are made to be interactive. Not only can you see the function names for each stack frame, but if you click on it the graph will zoom in on that stack frame. This makes it easier to focus in on certain areas of the stack trace to identify hot-spots.

The shading in a flamegraph does not have any significance other than looking cool, and providing visual differentiation between stack frames. Check out the example flamegraph below.


Click on any frame to zoom in. The plateau in the middle of this flamegraph is ripe for optimization. Click 'reset zoom' in the top left corner to zoom back out.


Now that we have this beautiful data visualization, what do we do with it?


The purpose of this visual tool is to identify areas of the call stack where your application is spending too much time. That means you want to look for stack frames that are particularly wide. But not just any wide frame. The bottom stack frame might be the widest, but that doesn't necessarily mean it is inefficient if it is spending all of it's time calling the other functions above it.

The most inefficient areas are indicated by plateaus in the flamegraph. A stack frame that is wide, and on top of the call stack is what you want to look for. That indicates a process that is taking a long time to run itself.

Take the example above. Looking at the plateau in the center shows several stack frames that are frequently present on the call stack. Specifically the LazyCompile:*get /home/ubuntu/CodeSmith/node-example-flamegraph/node_modules/fast-levenshtein/levenshtein.js:27 call frame, and the ones above it. If you hover over this frame, you will see that it is present on the call stack 58.79% of the time. 12.63% of that is just this frame itself (to the left, where there are no frames above it). There are several frames above this one that also spend a lot of time running on the call stack. These are areas that need to be improved to optimize the overall efficiency of this particular application.

Interested in learning more about flamegraphs? Head on over to Brendan Gregg's site, the inventor of flamegraphs and inspiration for INFERNOde.


Icicle Graphs

Interpreting Icicle Graphs

Icicle Graphs are actually just flamegraphs with a cooler color scheme, flipped upside down.

These are handy for especially deep stacks. The flamegraph GUI starts at the top, so it can be annoying to scroll all the way down every time a graph loads. Flamegraphs are .SVG files, and how they display will vary depending on the browser. Icicle graphs solve that problem by flipping the graph.


The call stacks on the left side of this graph are quite deep. Using an icicle graph keeps you from having to scroll down to see the bottom of the call stack.


Differential Flamegraphs

Interpreting Differential Flamegraphs

INFERNOde is able to take any two of your flamegraphs and generate a differential that highlights what changed. This is especially useful if you have two different versions of your application software, and you want to know what got faster or slower. It does this by comparing the width of each frame in the graph, then assigning a new color scheme to show the differences. Unlike the other graphs, the shading of a differential graph is important.

In the example below, we took two different copies of the same application, and profiled them separately with INFERNOde. Then we diffed them to create the differential graph you see here.


The stack frames that increased the total amount of time spent on the call stack are shaded red.

Looking at the example above, you can see the stack frames that grew are shaded red. The ones that grew the most appear a darker shade of red. Any frames that got faster will be shaded blue. The more they improved, the darker blue it will be. White frames did not change at all.


Thanks for using INFERNOde! If you're interested in contributing to the project, check us out on Github and send us message!

If you want to know more about INFERNOde then head on over to the About page, or read our article on Medium.